Skip to content
(no title)
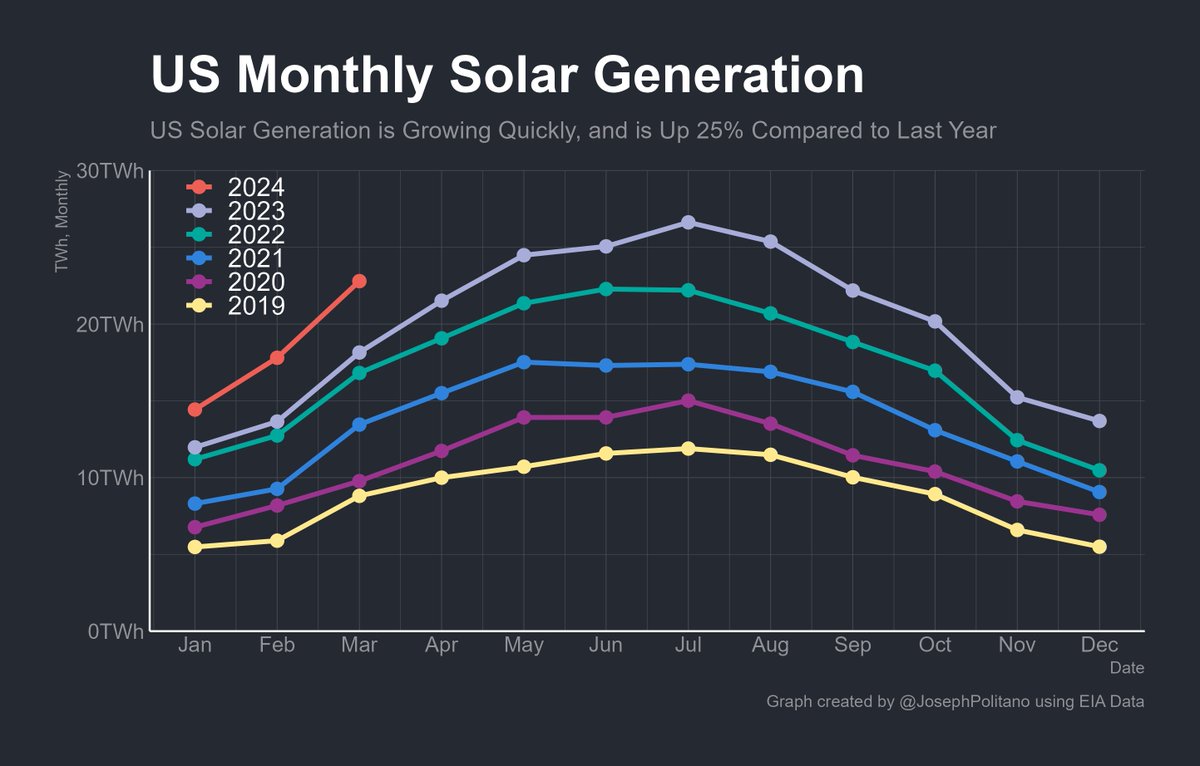
US Monthly Solar Generation #chartoftheday (via @JosephPolitano) EIA data shows solar generation in March in the US was up 25% compared to last year.
Share this:
Share on X (Opens in new window)
X
Share on Facebook (Opens in new window)
Facebook
Like
Loading…
Chart Of The Day
June 5, 2024
Chart Of The Day
Reblog
Subscribe
Subscribed
Chart Of The Day
Sign me up
Have a WordPress.com account?
Log in now.
Chart Of The Day
Copy shortlink
View post in Reader
Manage subscriptions
Sign up
Log in
Report this content
Collapse this bar
%d